 Power BI
Clothing Sales Performance Dashboard
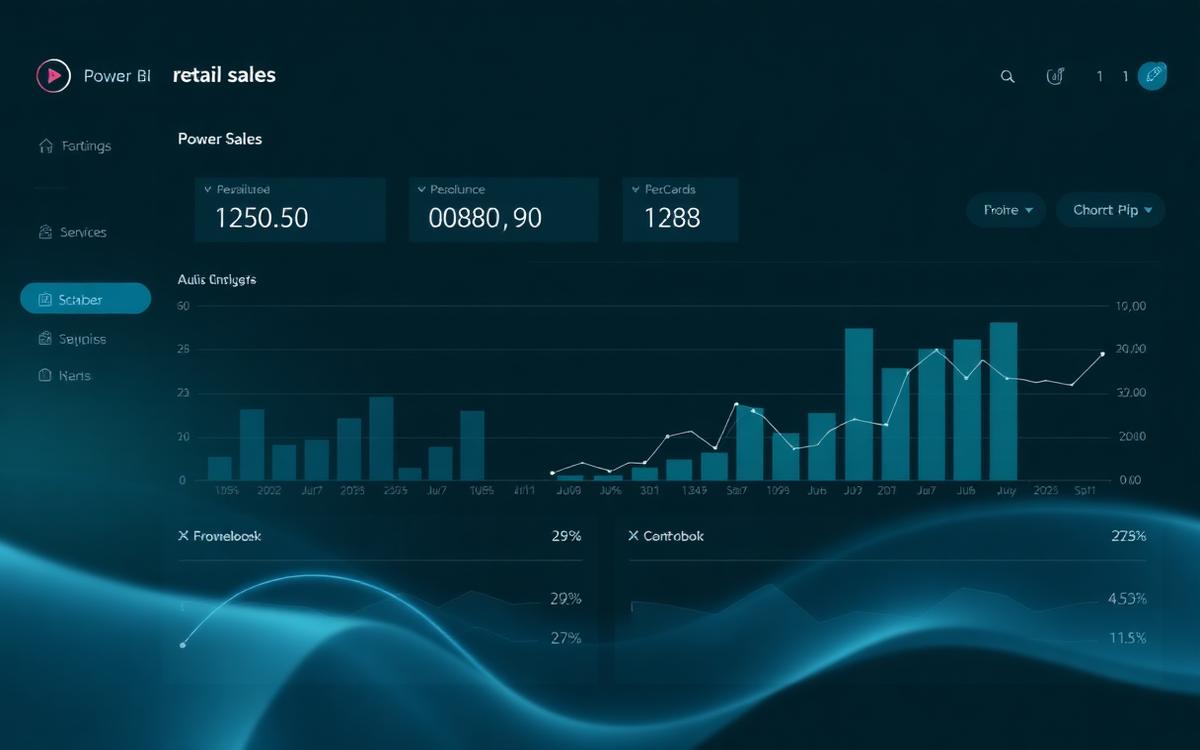
An interactive Power BI dashboard tracking revenue, category mix, regional performance and customer segments for a clothing retailer, built on a cleaned and modelled sales dataset.
Impact
Replaced manual monthly reporting with a single self-serve view, cutting the time to answer a sales question from hours to seconds.
Full case study
Business problem
Sales performance lived in monthly spreadsheets, so basic questions about which categories and regions were carrying revenue took hours to answer.
Solution
Cleaned and modelled the sales data, defined DAX measures for revenue, average order value and growth, and built a filterable dashboard by category, region, season and customer segment.
Insights
- A small group of categories generated the majority of revenue while occupying a disproportionately small share of inventory attention.
- Regional performance diverged sharply in peak season rather than across the year as a whole.
- Average order value, not order volume, explained most of the month-on-month revenue movement.
Recommendations
- Re-weight stock and promotion budget toward the categories driving revenue concentration.
- Plan regional campaigns around the peak window instead of spreading spend evenly.
- Track average order value as the primary sales KPI alongside total revenue.
- Power BI
- DAX
- Data Modeling
- Excel
- #Retail
- #Dashboard
- #Revenue Analysis